
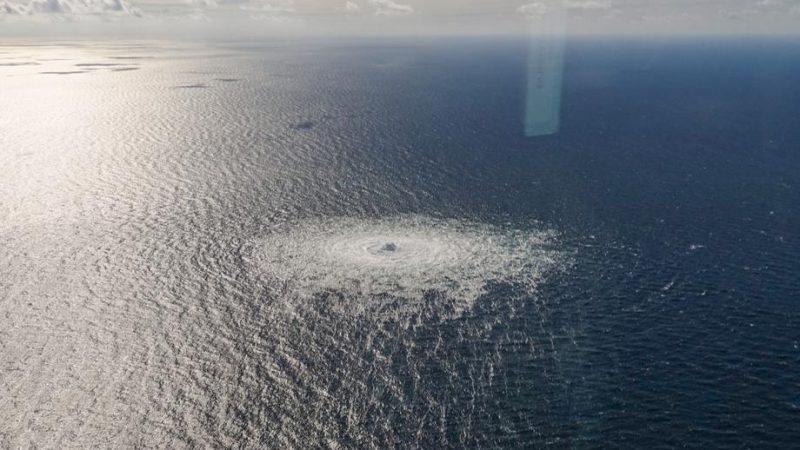
The gas leak at Nord stream 1 and 2 undersea pipelines have been observed on the 26’th of September 2022.
- Nord stream gas pipelines
- Investigation of the gas leaks
- Local mixture ratio of Gas at the leakage sites – A ballpark estimate
- Ball park estimate of gas concentration
- News agencies provide leverage to ESA
- Measurements of the enhanced Methane gas concentration from space
- Concluding remarks
- Links and references
Nord stream gas pipelines
The Nord Stream 1 and 2 pipelines are undersea pipelines capable of supplying the European union with gas from Russia. The picture of the emissions can be seen on Figure 1.
Investigation of the gas leaks
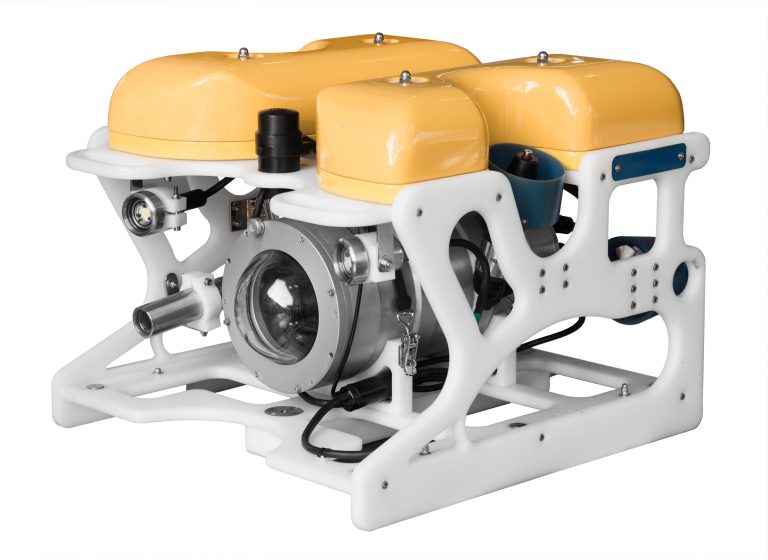
To investigate what caused the sudden eruption of the undersea pipeline leakages. An underwater remote operated vehicle (ROV), see Figure 2, was sent down to one of the undersea pipelines.
Authorities and the general public assumed the coherent leakages to be the result of sabotage as the likelihood of four coherent ruptures seemed highly unlikely.
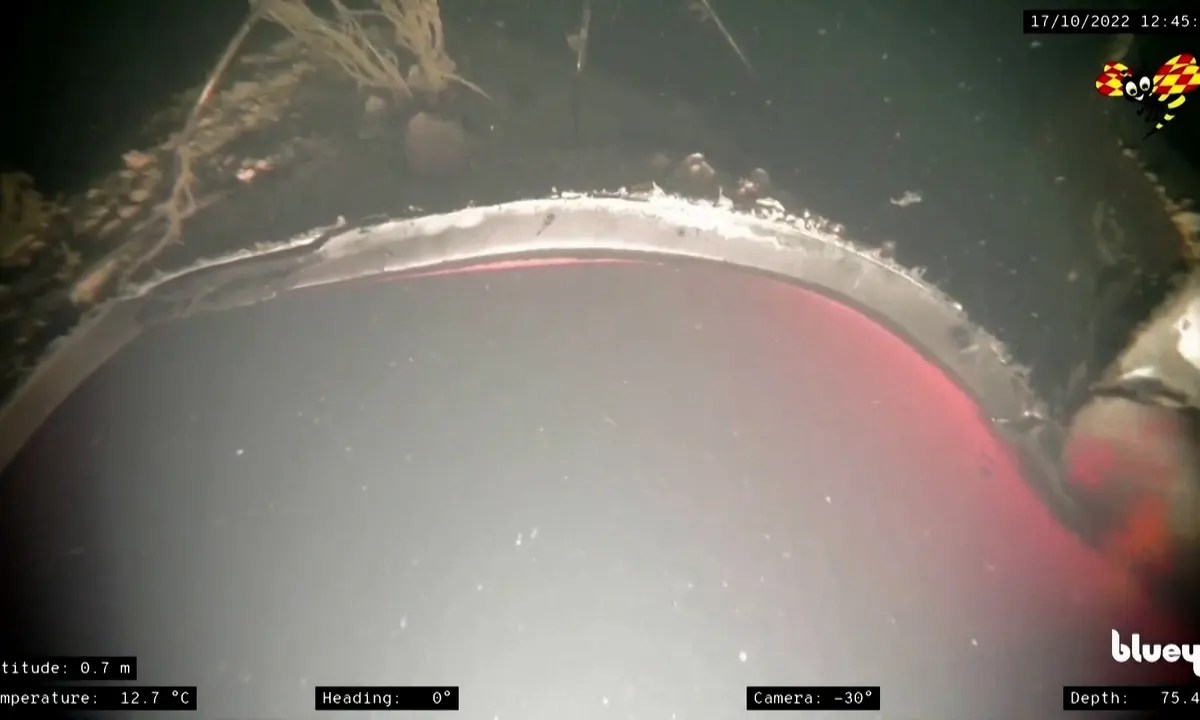
Pictures from one of the leakage sites where made publicly available and elucidating that the leaks were caused by explosives placed on the pipeline where a small explosive could lead to a zip-line effect of damage on the pipeline.
Close-ups of the undersea pipelines from the remote operating vehicle can be seen in Figure 3.
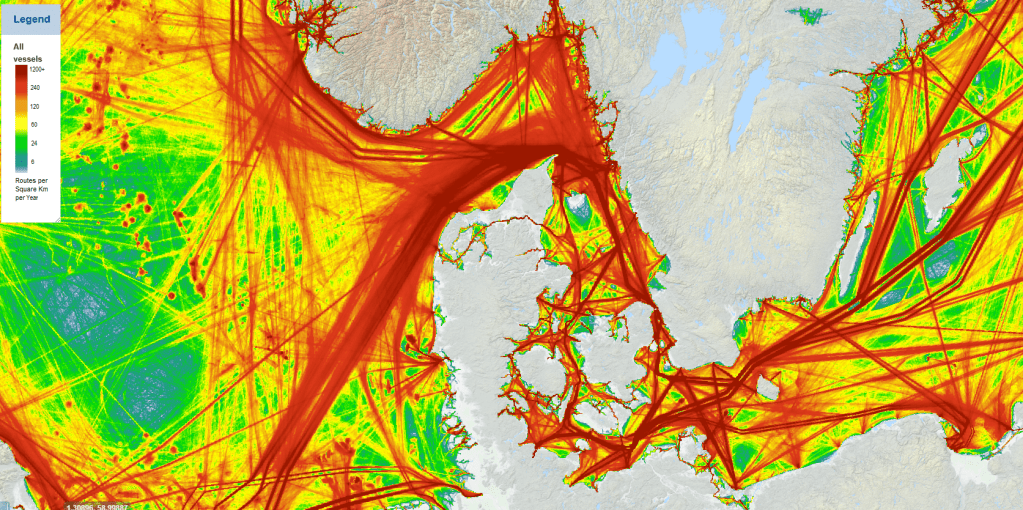
To understand where the leaks occur and to get a sense of the depth at the site of the occurrence, I have created a map overviewing the depth-map and pipeline lines at the sites in the figure below.

This bathymetry maps allows users to see how far down the charges would need to be placed in order to be clamped onto the pipelines.
Local mixture ratio of Gas at the leakage sites – A ballpark estimate
The ambient mixture ratio of methane to atmospheric air is approximately 1.896 ppb (parts per billion) according to recent studies from the National Oceanic and Atmospheric Administration.
Lets try and uphold this value with an estimated local value at the site based on scientist estimates of the amount of gas leaked.
Approximately 300,000 – 500,000 tons of methane gas is estimated to have been released during the period of the gas leak.
Ball park estimate of gas concentration
Now lets try and estimate the concentration of methane gas at the surface assuming that we have released the scientist estimates through a period of 7 days, assuming a constant emission flux.
The max volume of gas leaked can be estimated to be 7,61 * 108 m3 which happening over a period of 7 days corresponds to a mean flux of 1.258 m3/s.
Assuming that the amount is released and spread out evenly in a circular cylinder, spanning 10 m’s above the surface of the water with a radius of 700 m’s. We can first calculate the volume of the cylinder and next calculate the volume concentration.
Where, r is the radius [m], pi is the Pythagorean constant, h is the height [m] and V the volume of the cylinder. Plugging in the numbers provide an estimate of the volume to be 1.54 * 107 m3.
The ratios of these two volumes provide an estimate of the local volume concentration at the gas leak sites that is estimated to be
News agencies provide leverage to ESA
News agencies was quick to deliver headline news of the gas leakages near Bornholm island. Not long after posting the headlines, the European Space agency caught on and quickly utilized their high resolution satellites network to make remote sensing measurements of the methane gas concentrations.
Coupled with the visual inspections from ROV, overflight pictures and nearby vessel accounts. These concentration measurements allowed the construction of a safe zone around the leakages to be constructed easily.
Measurements of the enhanced Methane gas concentration from space
The European Space Agency has released satellite images measuring the methane gas concentration enhancement at one of the leakage sites. See Figure 5.

Now compare the satellite measurements with our ball-park estimate. We can see that our estimate is wrong with an order of magnitude 80. Given the rough estimates of dispersion characteristics and gas volume leaked this estimate is quite precise.
Concluding remarks
The allegedly sabotage happening at the pipelines are critical for the supply of Russian gas to the Europeans. The gas leakages are investigated with ROV enabling visual documentation, the overflight pictures capture the visual zone of emulsion and satellite remote sensing measurements capture the concentration estimates.
The conclusion is that the leakages are caused by explosive charges placed on the pipelines. In addition, the damages are substantial and it will be a while before the pipelines are fully operational again.
Lets hope that the incoming winters are sufficiently warm such that heating through gas won’t be the dominating factor going into the winter.
Links and references
https://natureunveils.com/ESA-GSG-methane-plume-detection-Nord-Stream
https://natureunveils.com/NOAA-methane-gas-ambient-concentrations


Leave a comment