In this blog post we will characterize the natural material silt. We will try and answer some of the most important questions in relation to silts such as; What is silt? What is silt used for? What is the difference between silt, sand and clay? Does silt pollute water? What is siltation?
- Definition of silt
- The Casagrande cup experiment
- Rolling tests determining plasticity level
- Differentiating clay from silt
- Siltation
Definition of silt
Silt is a characteristic soil whose grain size lies between that of clay and sand with sizes ranging between 0.002 mm and 0.063 mm.
Related read: Soil characteristics – sand, Natural materials – clay
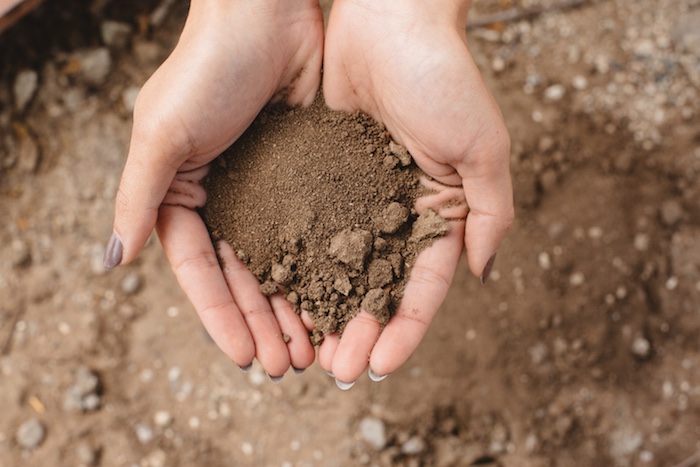
Silt is a detritus material meaning that it stems from weathered rock material and you can actually feel the individual particles between your fingers if rubbed gently. The physical properties of silt is hard to make general characterizations about as the individual properties depend on its ability to adhere to water and drain. An example of possible explanatory properties is the Atterberg limits.
Atterberg limits
The silty soil’s adherence to water makes it challenging to characterize accurately. As a result, the primary characteristic for understanding soil dynamics is the ability to describe the Atterberg limits of silty soil. These limits help describe cohesive materials regarding their strength and water limits; see source.
Related read: The Atterberg limits: History, evolution and perspectives
The Atterberg limits offer a straightforward way to assess the bearing capacities of wetted silt and clayey soils. These limits define essential states behind soil characteristics, effectively conveying the water content and corresponding soil behavior in a simple manner.
Individual soil states
The Atterberg limits describe four different states of silty and clayey soils: Solid, Semi-solid, Plastic, and Liquid.
Each state varies based on the type of clay and silt under investigation. The defining property is the soil’s ability to adhere to and retain water content. Generally, as the water content in silty soils increases, the soil transforms from a solid state to a liquid state.
Atterberg limits visualized
The definitive behavior of silts and clays stems from their ability to retain water within the substrate. This characteristic is best illustrated by the resulting stress-strain curves commonly used to define the bearing strengths of solid-state materials. Figure 1 outlines the different characteristic states of the material and the bearing capacity associated with each state.

With this initial explanation of the Atterberg limits, it quickly becomes evident the importance of defining each of these limits in an accurate manner.
Thought process behind silty\clayey soils bearing capacity
To set the stage for the upcoming explanation of why these limits are important, let’s visualize a scenario where a large infrastructure project is underway.
First, we actively inspect the initial area to identify any immediate obstacles that require removal before we conduct geotechnical investigations.
Second, a set of initial tests have examined the cross-section of the earth and found out that the initial state of the underground consists of a mixture of clay and silty soil.
Third, now one may wonder what the initial strength of such soils might be and if at all the soil exhibits sufficient capacity for bearing the load of the structure proposed for the site in question.
In conclusion, it is evident that understanding the bearing capacity of silty clay soils is essential for making the construction of larger infrastructures feasible.
As we now understand, it is important to estimate the limiting behavior of soils when subjected to loads and therefore we need to calculate the Atterberg limits. In the following sections we dive deeper into the calculation of the different types of Atterberg limits. Starting of with the liquid limit, LL.
The Casagrande cup experiment
The Casagrande cup experiment determines soil water content based on a standardized number of blows required to collapse a small valley created using specialized instruments. See Figure 2 for an illustration of the equipment and resulting collapse of the valley.
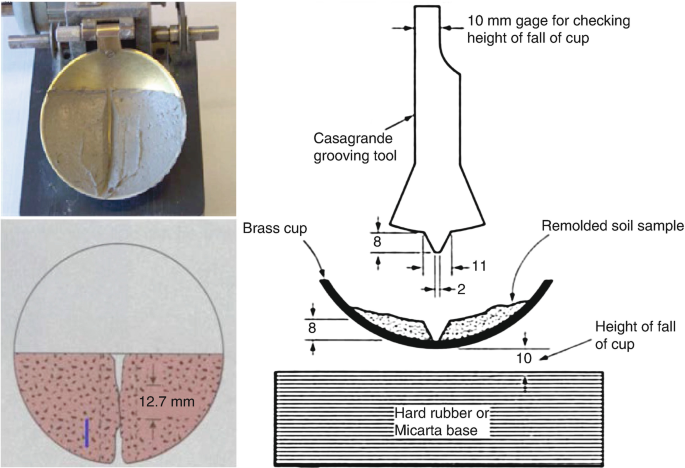
As the valley begins to come together, you should number the blows on a piece of paper. Weigh the soil sample before and after drying, carefully measuring the resulting weight. This process allows you to determine the number of blows required before the substrate’s failure mechanisms activate, based on the sample’s water content.
Next, draw a relationship between the number of blows and the water content. You can infer theoretical distributions for soil strength using careful regression techniques. Figure 3 illustrates an example of the relationship between water content and the number of blows, with the predetermined liquid limit defined for 25 blows to the sample.
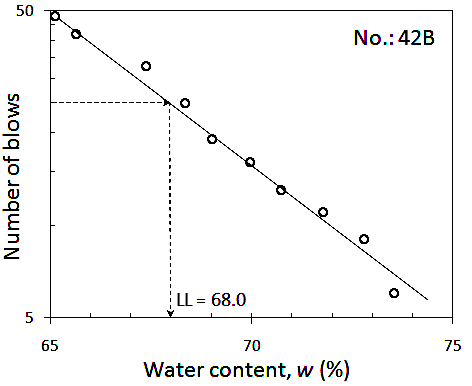
The liquid limit described by this test allows for an easy and fast interpretation of the liquid limit of silty clayey soils.
Now in order to try and estimate the plastic limit of the soil we need another test measure technique called the rolling test.
Rolling tests determining plasticity level
In order to determine the plastic limit of the soil, the limit where constant stress cause constant strain, we need to perform a rolling test on a sample of the substrate.
The methodology of performing a rolling test is in short to roll out a specific sample of the soil under assumptions of constant stress and cross section until the water content start to crack. When cracking is initiated the sample is quickly weighed before being dried out in the lab heaters for 24 hours.
Soil sample roll speed
When you roll out the soil sample, you actually dry it out. It’s important to understand that the speed at which you roll out the sample influences the drying rate and can lead to errors if you assume the sample has a constant water content.
Faster speeds and pressure on the silty soil sample will cause inaccurate measurements of the water contents due to the pressure distribution on the soil pushing out water from underneath the soil sample.

However, rolling out the soil sample slowly is neither a good option as the contents of the water sample is likewise going to dry out before being able to accurately predict the water contents.
To accurately determine the plastic limit of a soil sample, engineers need to use a perfect roll-out speed. This speed varies for different soil samples, so experts must apply their judgment to identify the appropriate speed.
Differentiating clay from silt
When investigating soil properties and characterizing the qualitative parameters of the soil sample, it is important to consider the distinct behaviors that separate silt from clay. You can easily make this distinction by using two different testing techniques. Firstly, you can utilize the ‘Elephant’ test technique effectively.
Elephant test technique
The elephant test technique is a quick and accurate way to distinguish soil behaviors without expensive field laboratory equipment. To perform the test, create a small soil sample in the shape of an elephant trunk, approximately 3 mm thick.
Examine the shape of the constructed elephant trunk to determine if it can withstand the force of its own gravity. If the trunk easily maintains its shape under its own weight, classify the soil sample as clay.
However, if the soil sample cannot easily support the force of gravity and exhibits deformed shapes or cracks on the surface, classify the soil sample as silt. This method offers a straightforward and cost-effective way to distinguish between silt and clay in soil samples.
Another commonly used methodology is to create a bent U-shaped sausage and then check for cracks in a similar manner as the elephant test. These inexpensive ways of determining whether a soil sample consists of clay or silt are invaluable.
That said, there are also other methodologies to easily investigate whether a soil sample is clay or silt, one of which is called a sedimentation test.
Sedimentation testing
The sedimentation test is a technique similar to the elephant test, intended to differentiate soil samples into clay and silt respectively. The clay particles when settling in a tube will create a mixture of solid particles and liquids called a suspension while a silt sample will create a coarser sample.
Suspension definition and behavior
A suspension is particular interesting when trying to investigate the hydrodynamic properties of a fluid and when trying to investigate eco-systemic impacts of large infrastructure projects.
Suspensions can easily affect the ecosystem. Endangered species are affected by floating clay particles that clot the gills of fish. Marine fauna such as eelgrass are threatened by sedimentation layers that steal available sunlight.
The problems also arrives when considering the time spent on the settling particle velocities which for a given suspension can be extremely small, allowing individual particles to easily stay in the suspended water column for extended periods of time before it will be able to settle on the ground surface.
For clay the particles can stay in suspension for hours even days without settling in still water due to the water undulations within the water column causing the fine material to keep sculpting around.
Settling behavior of silt
The difference in settling between clay and silt is easily measured when conducting sedimentation experiments. As explained, the clay settling velocities are small allowing for the suspension to keep particles in the water column for extended periods of time corresponding to days.
For silt the suspension will fall out of the water column much faster than clays and thus when investigating soil samples and characterizing the sample into clay and silt, measuring the settling time and velocities would allow you to easily distinguish the soil sample into clay and silt.
The silts settling velocity is much larger than clay due to mainly two phenomena, the particle sizes of silt are an order of magnitude larger and flocculation effects are often quite significant for silty materials. The flocculation is when particles of different sizes clump together during settling resulting in increasing settling velocity of the entire joint lump of particles compared to the individual ones.
This particulate behavior leads to a common phenomena called siltation.
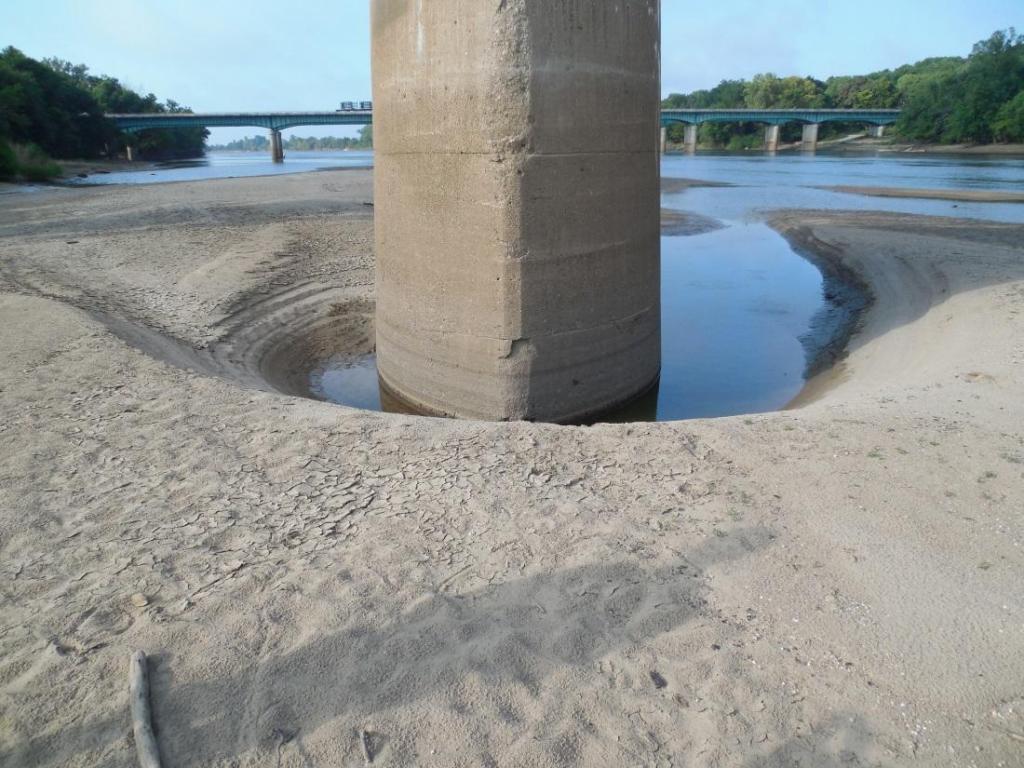
Siltation
Siltation is a common phenomenon in rivers, streams, and mouths, resulting from excavation, extreme rainfall events, or pollution. The siltation of river streams poses environmental dangers to ecosystems, as the resulting sedimentation strangles bottom-feeding and living creatures while simultaneously damaging eggs and larvae exposed to silted environments.
Siltation events commonly occur during marine dredging, as dredging operations actively transport silted material upward in the water column. The upward momentum enables particles to whirl up into the undisturbed water column, leading to the transportation of individual particles over large distances and their spread across potentially endangered areas.
Another example of siltation takes place during extreme rainfall events. Heavy rainfall erodes soil banks due to increased water volumes, washing silt and clay-rich materials into the water column.
When transported downstream and before settling down into calmer waters, this siltation of water streams can cause the suffocation of fish and the degradation of wildlife. Therefore, siltation events in rivers are considered environmental disasters.
References
Sources: Wikipedia.


Leave a comment