In this blog post we discuss the occurrence of ship allison (as opposed to ship collisions as the piers are not moving) in a simplified manner. Here we will focus on the ship size evolutions, causes and perspectives in modern day engineering.
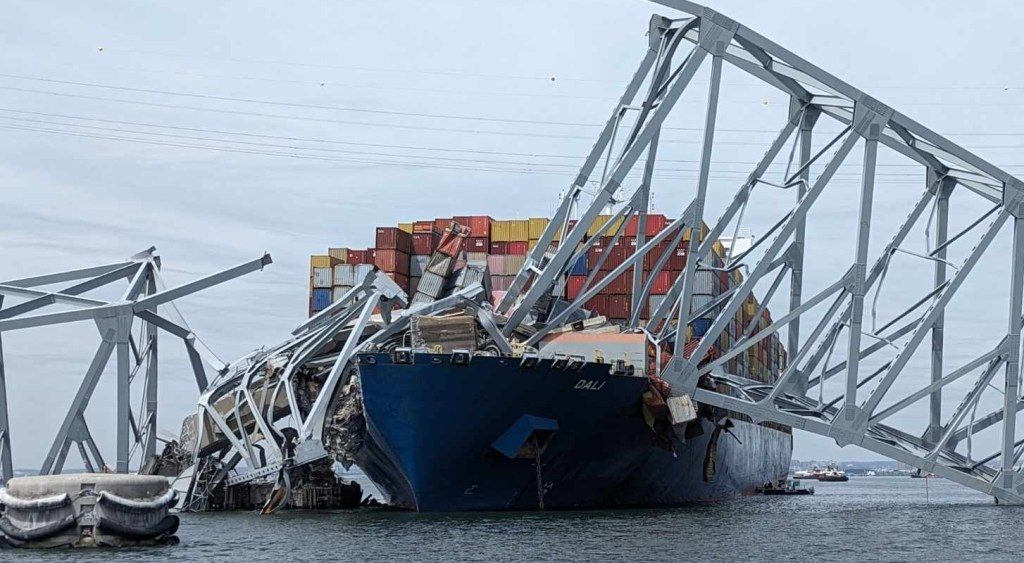
In particular we will make a deep dive into the recent ship allion happening in Baltimore on 26’th of March 2024 where a container ship hit the Francis Scott Key Bridge leading to collapse of the bridge and the tragic loss of life for six people.
- History of the Francis Scott key bridge
- Forces in a ship allison
- Safety of structures – probabilistic treatment
- Ship allison and wind
- Allison for the Francis Scott Key bridge
- Perspectives
- References
History of the Francis Scott key bridge
The Francis Scott Key Bridge, built between 1972 and 1977, took five years to complete and features typical steel girder construction, which was a common method at that time. Many differences exist between modern and historical construction methods, with one significant aspect being the safety and physical design of bridge dimensions. A key concept is the free height of the deck, known as freeboard.
During the bridge’s construction, engineers did not consider the freeboard of 56 meters between the water’s surface and the bottom of the deck to be low. They believed this height would adequately accommodate the types of ships expected to pass beneath the bridge. Consequently, the engineers envisioned a specific truss-sized bridge when they carried out the initial design.
Before we explore more about freeboard, let’s first appreciate the scale of the construction. Included is a picture of the construction site during the bridge pier construction, showcasing one of the two main piers before its completion, as seen in Figure 1.
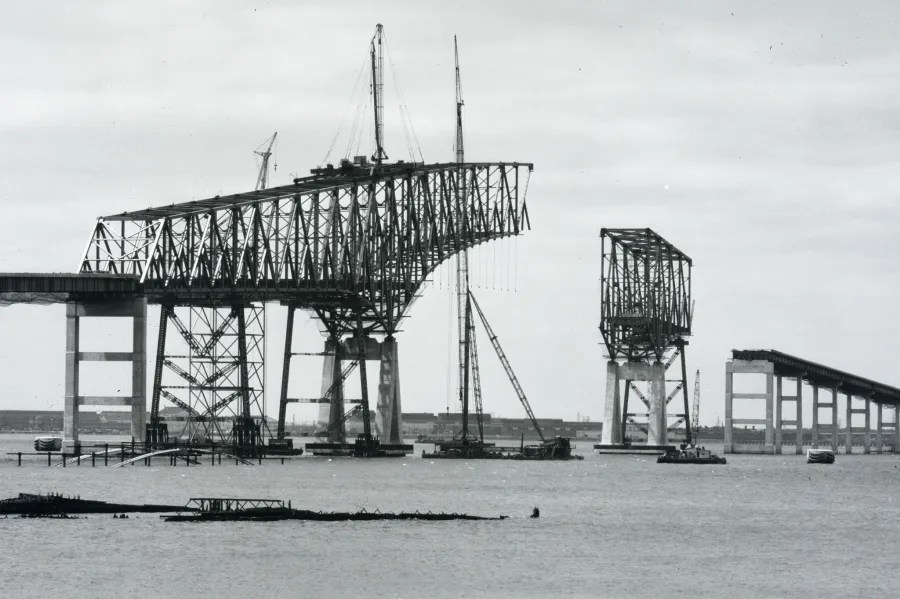
The engineers built the bridge in stages, using struts to carry the load of the structure while girders evenly distributed the weight across the span of the steel construction.
Construction phases
The builders constructed the bridge in two primary sections, with one span built on one side and the other span built on the opposite side. When the two sections met in the middle, they welded them together, which increased the carrying capacity because the connected structure was stiffer than the individual parts.
This principle is crucial in the design of the bridge as it provides redundancy to the structure allowing it increased carrying capacity ensuring safety of the structure minimizing the possibility of failure.
However no one could imagine the difference between modern day container ships and the ships traversing the seas back then. As this has a tremendous effect on the proposed loading which may be present in the piers during a catastrophic event.
Size of container ships
In order to visualize the growth of container ships during the time period check out this visualization graph from logistics learning showing the distribution in time of largest and average container ship sizes during the entire period from 1969 until 2023 outlined in Figure 2 below.
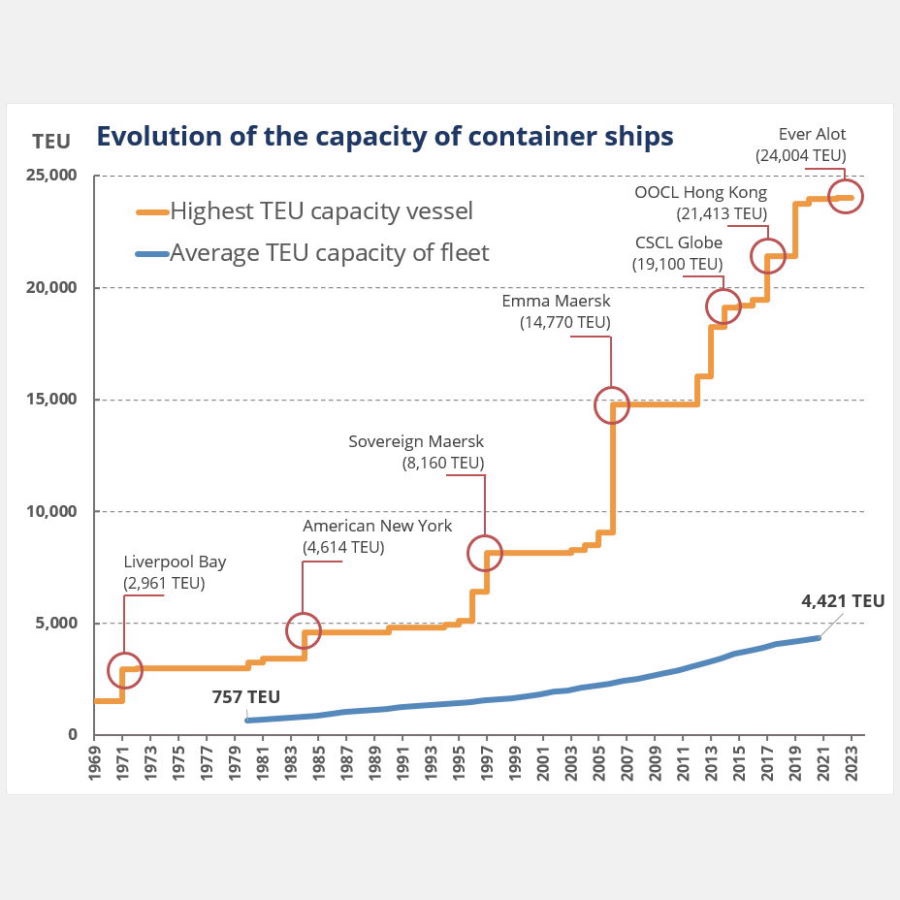
The data shows that the average size has more than tripled during this period, making it increasingly difficult to calculate the size of ships traversing underneath the bridge.
This increase in container ship size deeply influences the design calculations based behind the steel constructions. This has implications when trying to design measures capable of withstanding the future potential forces behind ship allisons.
Forces in a ship allison
Let’s now try and characterize the forces experienced in the structure during a simple allison with a bridge pier. In this scenario we will consider a case where the pier is experiencing a frontal allison with a ship.
We can assume that the ship and pier are both strong meaning that they will not fail during the impact. Now what kind of forces are needed in order to stop a ship allison going approximately 5 m/s? We may ask, well that depends on the ship size!
Weight of ships
Let’s start looking at the old days of an average tanker carrying an average load of 757 TEU (Twenty-foot equivalent unit). As this is not an weight we will need to determine a weight based on the TEU units carried.
Luckily, researchers have been looking into design metrics of ships including relationships between TEU and weight of the ship. Based on regressions from a database of ships, they have calculated relationships between our most important characteristics the DWT (DeadWeight Tonnage) a function of the TEU and GT (Gross Tonnage).
Relationships between the two
By investigating the relationships and combining them, we can estimate the approximate weight of a vessel fully loaded with the average TEU units. This estimation provides us with the mass of the ship used for the analysis. See Figures 3-5.
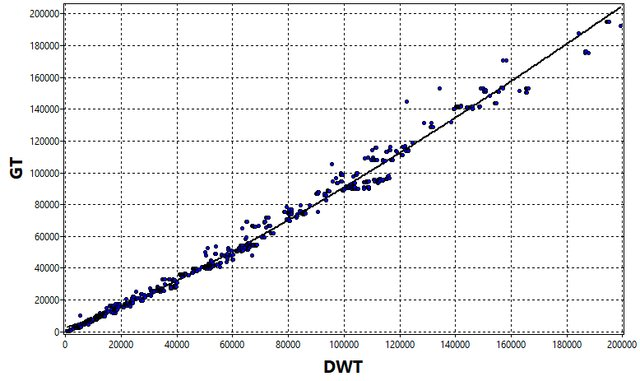
The primary difference between the DWT and the GT lies in what mass is included in the ship. When calculating the various loading scenarios and their effects on the ship’s performance, both measures play a role.
Weight in different terms
Figure 4 provides a clear visualization of how the ship’s weight is calculated and highlights the distinction between these two measures.
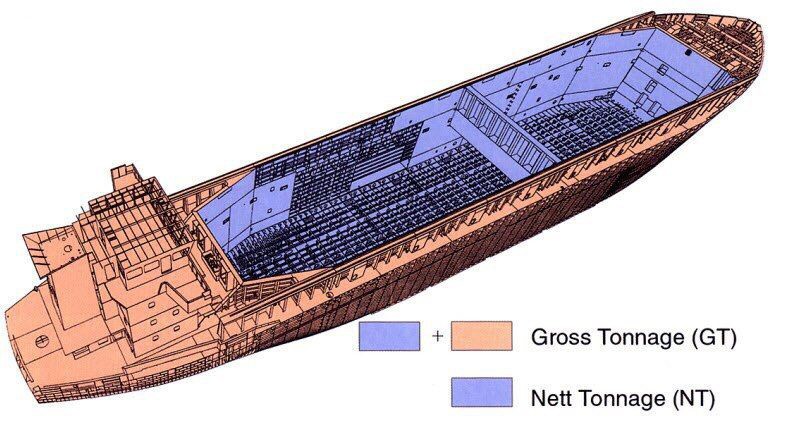
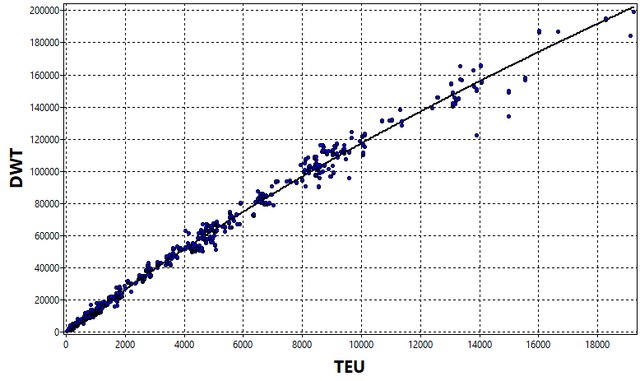
To relate the GT and the TEU, we established a relationship curve between the TEU and DWT. Since the DWT and GT show a nearly linear correlation (with some scatter), we can conclude that the TEU and GT also scale somewhat linearly, as illustrated in figures 3 and 5.
Utilizing the weight of the ship based on these regression models combined with the famous newtons laws of physics we can start to evaluate the forces involved in the accident considering the average size of ship in the 1977 compared to the average size in 2024.
Newtons laws and impact forces
In this example let’s assume that the ship moves with about 5 m/s and is taking 5s to stop entirely. Furthermore from the TEU graph and the DWT can estimate the mass of the vessel in tonnes.
From reading the graph we see that the average mass of the vessel carrying 747 TEU is about 10.000 tonnes. While the vessel carrying 4.421 TEU has a weight of 60.000 tonnes.
Now the famous newtons laws are utilized to estimate the force involved due to this acceleration experienced. Here considering the average acceleration during impact of the bridge.
F = m * a
By utilizing the different assumptions from above, we estimate the force to be approximately 10 MN for the average-sized ship in 1977 and around 60 MN for the average ship in 2024.
To put this in perspective it takes around 22 MN in order to lift the payload into space. Said in another manner, it is a very violent catastrophe when ships impact bridges.
Safety of structures – probabilistic treatment
To address the fortunately rare occurrence of ship impacts, engineers can analyze the forces in a probabilistic manner, approximating the distribution of these events in both time and space while considering their rarity.
Engineers commonly use methods to approximate loads for various projects, taking into account the differences in size, shape, and magnitude of load distributions, as well as the occurrence of incidents and relevant uncertainties.
Assumptions and equations
These methods depend on simple yet crucial assumptions necessary for ensuring safe and effective design approaches for structures capable of withstanding such forces.
The following equation outlines the common design considerations for structures that may face ship allisions.
AF = (N) (PA) (PG) (PC)
Where AF is the annual frequency, N is the number of vessel transits (classified by type, size and loading condition), PA is the probability of vessel aberrancy, PG is the geometric probability of an allison between an aberrant vessel and a bridge pier or span, PC is the probability of bridge collapse due to an allison with an aberrant vessel. These are all covered in great detail in the handbook, “Vessel Collision Design of bridge”, which also detail the different scenarios and how to accurately account for variabilities in the vessel density, geometric deviations of the ships or piers and actually estimating percentages of the individual contributions.
These assumptions are based on safety considerations, freespan of the bridge, distance between deck and sea water and most probable causes encapsulating rarity and magnitude in the unlikely event that is a ship allison.
Safety of structures – partial coefficients
Now, of course, engineers recognize that differences exist between these rough estimations of forces and the ones used for designing structures. They leave out fundamental factors, such as the partial coefficients applied to both the structural steel strength and the loading in the struts and girders. Typically, they exaggerate the loading forces while minimizing the bearing capacity of structures.
This procedure captures the essence of civil engineering, as the safety of everyday structures relies on proper design codes and rigorous procedures that account for minor errors, which are often challenging to quantify and examine in real engineering projects.
Engineering approach
Engineers find it difficult to determine the best partial coefficients, requiring careful consideration. Accurate determination is essential for understanding the material and force properties of the approximate reality they aim to construct.
However, this information alone does not suffice to ensure bridge stability, as engineers must assess combinations of different scenarios for the safe construction of bridges. To offer insights into the complex world of loading structures, we will consider some opening thoughts on load combinations.
Safety of structures – load combinations
Even with the partial load coefficients in use, you still haven’t met the load requirements for which the structures are designed.
To achieve a specific design load, you must consider the various circumstances the structure will encounter throughout its lifetime. These factors include snow, wind, vehicle loads, deadweight, and, for bridges over water, ship collisions.
In general, wind is the most common external force that bridges need to withstand during typical conditions. This scenario is relatively well understood, although there is minor uncertainty regarding the extreme winds that may occur during gusts.
Wind and ice combination
In order to arise in a specific scenario one would then have to combine this well understood wind loading with for example ice loading which may occur on the cables struts and girders of the structure during winter.
This allows engineers to calculate the forces using a wide variety of coefficients and similar for the development of the worst case scenario combination. This could, as an example, be a cold winter storm where the temperature and winds are dominating the environmental conditions.
Ship allison and wind
Another example would be a ship allison during windy weather where the collision forces itself agree the most dominating issue compared with the rest of the scenario.
However unlike the wind the loading during ship allisons are more difficult to account for as the sizes of ships and trading routes are dynamic meaning that what is the biggest and most critical scenario now is not the worst in 10 years or more.
This makes it difficult to account for and as you have seen the forces involved are quite extensive.
Remedies for ship allisons
Engineers have developed various alternative safety measures to secure bridge piers and columns against impacts from ships, particularly container ships, which are typically larger than ordinary vessels; their impacts are critical to consider, as demonstrated in the case of the Francis Scott Key Bridge.
Allison for the Francis Scott Key bridge
Now for the case of the Francis Scott Key Bridge. Here we have a different scenario where a container ship impacted the bridge on the 26th of March 2024. This ship was quite different from the one that engineers had previously thought was the largest, occurring more than 40 years after the bridge was built.
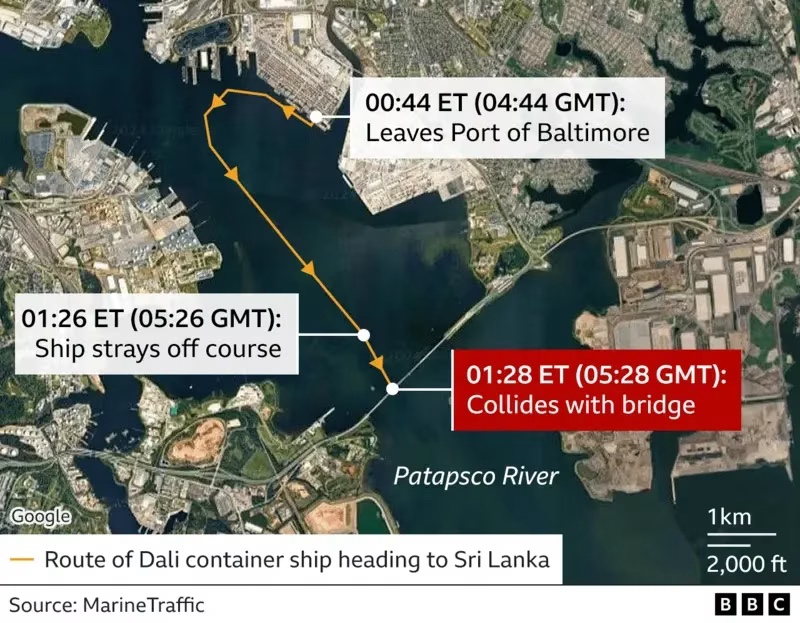
In order to understand what happened before the incident let’s look into the pathway of the container ship immediately before impact as outlined in Figure 6.
Considering the impact of the ship destroyed the bridge, it is necessary to understand what happened and how it happened.
Related read: Stabilizing the leaning tower of Pisa, Earthquake proofing buildings, Effective investment strategies for climate adaptation
For this understanding the bureau of transportation looked into the ship logs and noticed that the ship had issued a mayday statement immediately before the incident meaning that it had at that point in time lost control over the vessel causing it to drift away. This is what happens when ships of this size losses engine power.
Ship drifting
The ship drifted off course going under the bridge and accidentally hitting the bridge column leading to failure off the bridge.
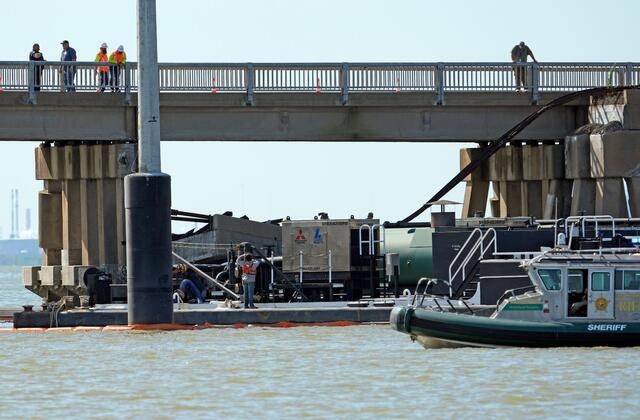
The aftermath of the collapse showed that tragically six people working on the bridge deck, during renovation of the deck lost their lives in the accident. They were fixing potholes when the bridge deck collapsed into the water.
Following the incident the president of the United States was out declaring that the state would pay off the renovation work of the bridge construction.
Perspectives
The design of bridges and bearing structures is a complicated discipline of civil engineering and particularly the handling of ship allisons is difficult to accurately account for in the design phase.
The rise of increasingly larger container ships makes setting the appropriate freeboard increasingly challenging. This task largely hinges on complex macro-scale phenomena and trade patterns, which are influenced by the available road networks and access to flood deltas.
Overlooked problems
The accident at the Francis Scott Key Bridge has shed light on the often-overlooked problems we face in daily life. Rebuilding the bridge will require skilled engineers to thoroughly think through the new design, incorporating remedies to minimize the risk of a similar collapse occurring in the future.
Unfortunately, the chaotic dynamics of our world present ongoing challenges and dangers for everyone. It is likely that we will see more bridge collapses arising from unpredictable events.
For instance, in 2024, another incident unfolded when a barge struck the bridge connecting Galveston with Pelican Island, leading to a partial collapse and an oil spill in the area surrounding the barge.
The economic costs and labor intensive feats needed for constructing and rebuilding bridges are quite extensive. This means that accidents should be kept at an absolute minimum in order for the built environment to be perceived as safe and sound for everyone involved.
References
Tomasz et al. 2018. “Determination of Regression Formulas for Key Design Characteristics of Container Ships at Preliminary Design Stage” New trends in production engineering.
Knott, M., Pruca, Z. “Vessel Collision Design of Bridges” Bridge engineering handbook. Boca Raton, CRC Press 2000.
Evolution of the container ship size: https://logisticselearning.com/largest-container-ships/
Construction of Francis Scott Key Bridge before being finished in 1977. https://www.newsnationnow.com/us-news/northeast/francis-scott-key-bridge-history/
Pathway of the Francis Scott key bridge container ship before impact. https://www.bbc.com/news/world-us-canada-68664664.amp
Francis Scott Key Bridge collapse: https://www.nab.usace.army.mil/Media/News-Releases/Article/3719448/us-army-corps-of-engineers-leading-effort-to-clear-fort-mchenry-channel-followi
Barge hitting bridge in Galveston: https://www.usnews.com/news/best-states/texas/articles/2024-05-15/barge-hits-a-bridge-in-galveston-texas-damaging-the-structure-and-causing-an-oil-spill


Leave a comment